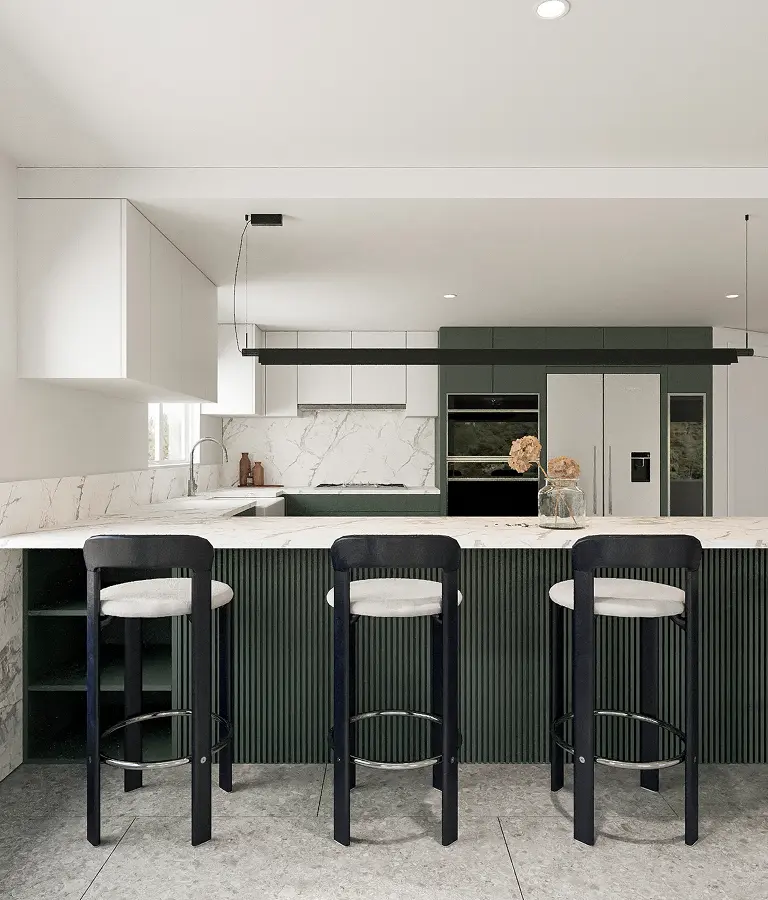

In short: the renovations that return the most value for Seattle-area homeowners in 2026 are, roughly in order:
- Kitchen remodel (mid-range) — 60–80% ROI
- Fiber cement siding replacement — up to 80% ROI
- Basement remodel — up to 70% ROI
- Bathroom remodel — 60–70% ROI
- ADU / DADU — rental income plus an appraisal lift, rather than a single fixed percentage
- Energy-efficient upgrades (windows, insulation, HVAC) — lower utility bills and a faster sale, again without one clean ROI number
The rest of this page explains where those figures come from, why they shift depending on your neighborhood, and what the percentages don’t tell you.
Where to Go for Project-Specific Numbers
If you already know which project you’re planning, these guides go far deeper than we will here:
- Kitchen Remodel Cost in Seattle: What 2026 Budgets Actually Look Like
- ADU ROI: Rental Income vs. Property Value
- Does an ADU Add Value to Your Home?
- Whole-Home Renovation Cost in Seattle 2026
- Window Frame Materials Compared
How These ROI Figures Are Actually Calculated
Most renovation ROI numbers come from a simple formula: the estimated increase in a home’s appraised value after the project, divided by what the project cost, expressed as a percentage. National figures — like those in Remodeling Magazine’s annual Cost vs. Value report — are a useful baseline, but they’re averaged across the whole country. Seattle’s numbers move around within that baseline because of three local realities: heavy rain accelerating exterior wear, a persistent shortage of move-in-ready inventory, and a wide price gap between neighborhoods like Ballard and the Eastside. All three push certain projects (siding, basements, ADUs) closer to the top of the range than the national average would suggest.
Quick ROI Snapshot (2026)
| Project | Typical ROI Range | What Drives It | Go Deeper |
|---|---|---|---|
| Kitchen remodel (mid-range) | 60–80% | Layout, stone counters, appliances | Full cost guide |
| Bathroom remodel | 60–70% | Walk-in showers, vanities, heated flooring | — |
| Fiber cement siding | Up to 80% | Curb appeal, weather protection | — |
| Basement remodel | Up to 70% | Added square footage, no footprint change | — |
| ADU / DADU | Rental income + appraisal lift | Zoning, size, finish level | ADU ROI breakdown |
| Windows, insulation, HVAC | Lower bills, faster sale | Utility savings, buyer demand | Window materials compared |
Two categories in that table tend to surprise homeowners: siding and basements. Neither comes up as often as kitchens in renovation conversations, but both post some of the highest returns specifically in this region. Siding earns its ROI because of how hard nine months of rain a year is on a home’s exterior — a Seattle roof or siding job protects against damage that a drier climate simply doesn’t cause. Basements earn theirs because they add genuinely livable square footage — a home office, a guest suite, a rentable studio — without triggering the permitting and cost of a full addition.

Why Seattle’s Market Changes the Math
National averages are a starting point, not a forecast for your specific block. Three local factors do most of the work in shifting the numbers:
- Rain exposure accelerates exterior wear. Homes here lose curb appeal and structural integrity faster than in drier climates, which is why siding and roofing upgrades consistently outperform their national averages in this market.
- Limited inventory rewards move-in-ready homes. Across Seattle, Bellevue, and the Eastside, buyers are competing for a small pool of listings and will pay a premium to avoid taking on a renovation themselves — good news if yours is already done before you list.
- Neighborhood ceilings cap what any single project can return. A $150,000 kitchen remodel in a neighborhood where comparable homes top out around $900,000 will not return the same percentage as an identical kitchen in a $1.5M home a few miles away — the surrounding comps set the ceiling, not the renovation itself.
What the ROI Percentages Don’t Tell You
A few caveats get lost whenever a number like “70% ROI” gets repeated without context:
- Timing changes the calculation entirely. A renovation completed six months before listing is priced for a specific, immediate buyer pool; the same renovation done for your own long-term enjoyment just needs to hold up over years of daily use, which is a different (and often easier) bar to clear.
- “Recoup” is not the same as “profit.” Even a strong 70% ROI still means you paid 30 cents on the dollar out of pocket for the improvement. The real return shows up in livability, faster days-on-market, and buyer competition — not as cash back in your pocket.
- Overbuilding for the block is the single most common mistake. Finishes that clearly exceed what similar homes on the same street offer — a $40,000 designer kitchen on a street of $500,000 homes, for example — rarely return their full cost, no matter how well they’re executed.
FAQ
Does ROI change if I’m not planning to sell soon? Yes. If you’re staying long-term, weight your decision toward projects that improve daily living — kitchen, bath, basement — over a project chosen purely for resale math, like siding. You’ll get years of use out of the former before any resale calculation ever comes into play.
Is an ADU a better investment than a kitchen remodel right now? It depends on what you’re optimizing for. A kitchen remodel raises appraised value in a single step; an ADU can do that too, but it also generates monthly rental income in the meantime, which changes the payback timeline entirely. See our ADU ROI breakdown for numbers specific to that comparison.
How much of the ROI depends on the contractor I choose? More than most homeowners expect. Licensed, code-compliant work protects the appraised value you’re counting on; permit shortcuts or under-spec materials are one of the fastest ways to turn a high-ROI project into a liability at inspection or resale.
Where do these percentages actually come from? They’re a blend of national data (adjusted regionally) and local appraisal patterns we see across our own project history in King, Snohomish, and Pierce County — not a single published source, since no annual report tracks Seattle in isolation.
Ready to see what these numbers look like for your specific home? Call us at (425) 800-7663 for a free in-home consultation — we’ll walk your property and give you a straight answer on scope, timeline, and expected value, not just national averages.


